
Dash, and plotly, are perfect candidates for exposing models and predictions to the real world. In this guide, we are going to show how to deploy a Dash application that uses a Machine Learning model. The model is hosted by Provision.io’s AI management platform which delivers production grade predictions via API.
We going to build build a very simple application that does two things :
- Calls a multiclass model with a text input
- Get the result and display the probability of each class as a bar chart
Prerequisite
- You need a git repository to deploy your app. Deploying a Dash application is done by connecting a git repo to Provision Platform.
- To apply this tutorial, you should train and deploy a model. You can access the used dataset in our Data section. This dataset has a text column and a multiclassification label that allows you to use it with this tutorial (you can even get a holdout)
Project architecture
You can clone this project to get a boilerplate :
git clone https://github.com/Provisionio/Provision-dash-app.gitRequired
In order to deploy your project to Provision.io platform you must have :
- A requirements.txt file that contains needed packages at the root folder
- A py file, also located at the root folder
Advised
A simple but efficient folder structure is :
- A service folder, with all your API call (and a model.py file for calling Provision model)
- An asset folder with your CSS (for example css and styles.css)
Setup
In order to create a dev environment to code and test your application :
- Create a virtual env
- Activate it ̀
- Install requirements
- pandas
- plotly-express
- dash
- gunicorn
- Rename the .env.example file to .env and fill it file with your model url, id and secret (get it on the deployed model page)
- Launch the app with gunicorn
git clone https://github.com/Provisionio/Provision-dash-app.git
cd Provision-dash-app
python -m venv env
source env/bin/activate (or .\env\Scripts\activate if you are a windows user)
pip install -r requirements.txt
gunicorn --bind 0.0.0.0:8080  --threads 10 -w 2 --timeout 120 --limit-request-line 0 --access-logfile - run:app
Note to windows users: gunicorn does not work on windows but you can use waitress instead.
1. replace gunicorn with waitress in your requirements
2. launch the following command instead :
waitress-serve --listen=*:8080 run:app
If everything works fine, you could open (http://localhost:8080) with your browser and you should see a simple interactive dashboard
Warning
Your app must work with the following option :
gunicorn --bind 0.0.0.0:8080 --threads 10 -w 2 --timeout 120 --limit-request-line 0 --access-logfile - run:appCheck that your “main” file is named run.py and that the dash app server is bind to the app variable :
dashboard = dash.Dash(__name__)
app = dashboard.server
Calling the model
If you want to use a Model hosted on Provision.io, you need to initialize a request-oauthlib client. Do it in the services/model file.
You should have your credentials in a .env file
load_dotenv()
client_id = os.getenv('client_id')
client_secret = os.getenv('client_secret')
model_url = os.getenv('model_url')

client = BackendApplicationClient(client_id=client_id)
Then write a function that sends the form data as a POST request json payload. Here the model has only one feature, text but you need to change this according to your model feature
def send(text):

    try:
        predict_url = f"{model_url}/predict"

        payload = json.dumps({
            "text": text
        })
        headers = {'Content-Type': 'application/json'}

        oauth = OAuth2Session(client=client)
        oauth.fetch_token(
            token_url=
            'https://accounts.Provision.io/auth/realms/Provision.io/protocol/openid-connect/token',
            client_id=client_id,
            client_secret=client_secret)

        prediction = oauth.post(predict_url, headers=headers, data=payload)
        res = prediction
        data=res.json()

        # You can transform the response to help the client
        pred = transformres(data)

        return pred
    except ConnectionError:
        logging.error("Cannot call model")
        return {}
Building the Dashboard
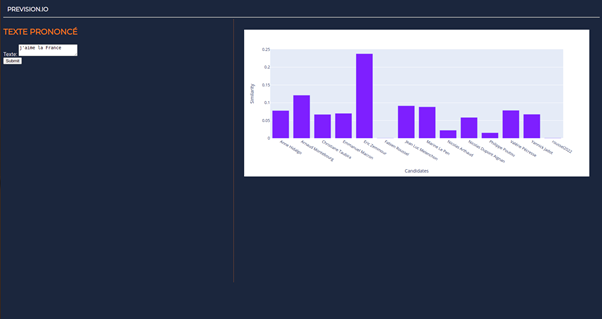
The dashboard is a basic interactive app with a form and a chart. When the submit button event is triggered, the state of the form is sent to the model and the response is use to update chart data
# Initialise the app
dashboard = dash.Dash(__name__)

# just  a test
default_text="j'aime la France"
res = model.predict_query(default_text)
print(res)

df = pd.DataFrame({
    "Candidates": [candidate["name"] for candidate in res["predictions"]],
    "Similarity": [candidate["similarity"] for candidate in res["predictions"]],

})

# Define the app Layout here
dashboard.title = 'Analytics Dashboard'

fig = px.bar(df, x="Candidates", y="Similarity", barmode="group")

form = html.Div([
    html.H3("Texte prononcé"),
    html.Div([
        "Texte: ",
        dcc.Textarea(id='src-txt', value=default_text  )
    ]),
    html.Button('Submit', id='submit-val', n_clicks=0)

])

panelling = html.Div([html.Main(children= [form]), html.Aside(children=    dcc.Graph(
        id='barchart',
        figure=fig
    ),)], className='vertical-panelling')


dashboard.layout = html.Div(children=[
    html.Header(children=html.H1(children = 'Provision.io')),
    panelling,
    html.Footer(children="Copyright")
], id="container")


# A callback that listn to form submit and call the model
def init_callbacks(dash_app):
    @dashboard.callback(
    Output('barchart', 'figure'),
    Input('submit-val', 'n_clicks'),
    State('src-txt', 'value')
    )
    def update_graph(n_clicks, value):
        res = model.predict_query(value)
        df = pd.DataFrame({
            "Candidates": [candidate["name"] for candidate in res["predictions"]],
            "Similarity": [candidate["similarity"] for candidate in res["predictions"]],

        })
        fig = px.bar(df, x="Candidates", y="Similarity")
        fig.update_layout(transition_duration=500)
        return fig


init_callbacks(dashboard)
app = dashboard.server
## Deploying the app in Provision env
Once everything works locally, put your code into your repo.
You need to give authorization to the Provision.io platform. Connect to Provision.io and go to profile > federated identity. add you gitlab or github repo then :
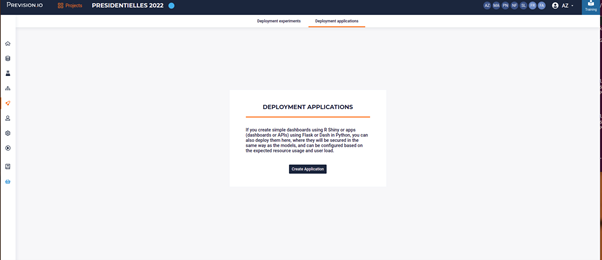
Go to Deployments > Deployment applications. Click ‘create application’
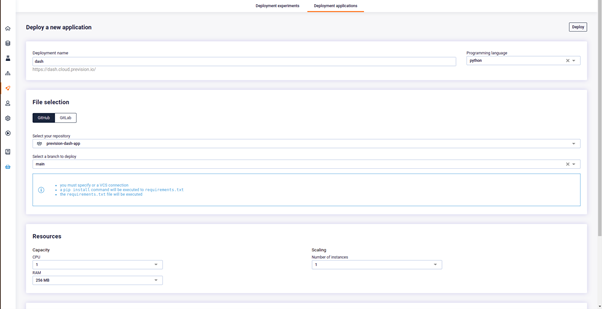
Fill the form. Plotly is a python framework so choose python as the programming language. Select your repo and folder
Do not forget to create 3 env variable and fill them with your credentials (or more if you add some to your project)
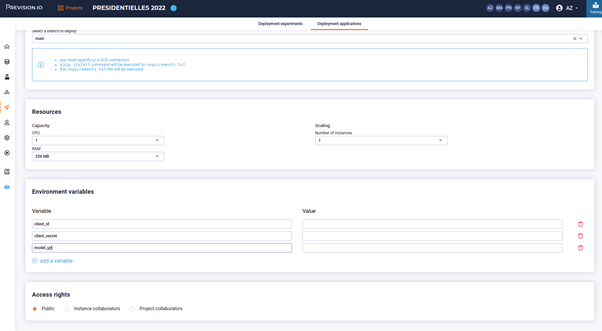
Click the Deploy button and wait for a couple of minutes. Your application will then be available to the url provided in the interface. If something fails, error logs are available in the log tab of the deployment page.
That’s it! If you have any questions, contact me at service@provision.guru