
Part I – An introduction to Machine Learning Metrics
To access the other articles, click below on the subject that interests you:
- Binary Classification metrics [LINK TO CLASSIFICATION METRICS]
- Regression metrics [LINK TO REGRESSION METRICS]
- Multi Classification metrics [LINK TO MULTI CLASSIFICATION METRICS]
In this blog post series, we are going to explore Machine Learning metrics, their impact on a model and how they can have a critical importance from a business user perspective.
As you know, building a machine model is an iterative process. For each step, you have to try and benchmark different data processing methods, feature engineering techniques, algorithm families, hyperparameters, etc.. In order to have a fair comparison of your iterations, metrics will definitely help you to consistently evaluate different models.
In this first blog post, we will introduce the notion of metrics and see how it differs from an objective function. In the follow-on articles, we will concentrate on specific metrics for classification, regression, and multi-classification. We will cover their definition as well as their pros and cons in real world applications.
Metrics vs Objective Functions
Any Machine Learning task can be seen as an optimization problem. The entry point is data (training data to be precise), which is crucial and will greatly influence the quality of your model. When you have gathered enough quality data, the next step is to preprocess it, then choose an algorithm among different technologies, and then train it.
In order to do so, you will need an objective function to which the model will fit the data. In a nutshell, an objective function is (guess what) a function that will most of the time be a kind of error that will quantify the quality of your algorithm. The lower the error, the better the algorithm.
BEGIN REFORMULATION
To train an algorithm, you need an objective function which will allow you to fit the data. Fitting the data means that the algorithm is going to learn some rules to explain the target variable. To correctly fit and learn from the data, you need to measure the error when you try to approximate the target. This is the objective of the objective function. It will quantify the quality of your algorithm and measure the error you make. The lower the error, the better the algorithm.
END REFORMULATION
In order to work well, especially for iterative algorithms, this objective function must have some very specific mathematical properties. In general, we ask it to be at least differentiable in regard to model parameters (and sometimes 2 times differentiable).
As a Data Scienstist, a good practice when starting a Machine Learning project is to create a default “dumb” model that will act as a baseline. For instance, for a regression problem it could be predicting a constant value (like the mean of the TARGET), or even always returning 0. If you’re dealing with a classification problem (meaning your target variable is of qualitative nature), a first try can be to randomly return 0 or 1 or always predicting the majority class. That’s the definition of a baseline. It will help you challenge and quantify improvement of your upcoming algorithms versus a very basic model.
In order to decide which trained algorithm has a higher predictive power (or make less errors), you will need a consistent and well defined process. This is when metrics show up. Metrics aim to compare and evaluate different trained models with a unique indicator (in fact metric estimation can be completed with an estimator of metric stability when doing a proper cross validation but everything revolves around the metric per say).
🚨Math alert🚨
If you’re not interested in mathematical differences between objective function and metrics, you can skip this section, which is independent of the next parts.
Now let’s explain it in a more mathematical and detailed way:
Let’s show that we need the loss function to be derivative. For simplicity, we will consider a linear regression and the feature space to be ℝ². We have n training examples , with Yi ℝ and Xi = (x1i, x2i) ℝ². We are dealing with a regression model, with no penalization to begin with. So the predicted value for Yi is Ŷi = ax1i + bx2i + c and we aim to determine (a, b, c) such as Ŷi is “close” to Yi . We measure how close Ŷi is to Yi with the squarred error, errori = (Yi – Ŷi )², then we average it through our n training examples to measure how close Ŷ = (Ŷ1, …, Ŷn) is to Y = (Y1, …, Yn), and we calculate the mean squared error, aka objective function, aka MSE = errori = (Yi – Ŷi )² = (Yi – ax1i – bx2i – c )²
Now let’s introduce the concept of gradient descent that is heavily used in most modern Machine Learning algorithms. Through an iterative process, we are going to decrease the MSE. The optimal value is 0, but we will be happy with a small value, as small as we want. We call it . We also want values of a, b, c to begin. We take a(0) = b(0) = c(0) = 0, at step 0.
Now, we calculate , , and
a(1) = a(0) + , b(1) = b(0) + , c(1) = c(0) + and we iterate while MSE is larger than .
An alternative is called early-stopping:
We calculate metric(Y, Ŷ(t)) and if it doesn’t decrease for x steps (x must be determined in advance), then we stop training
is called learning rate, and caracterize how deep the jump will be to go from a(t) to a(t+1). Same goes of course for b and c.
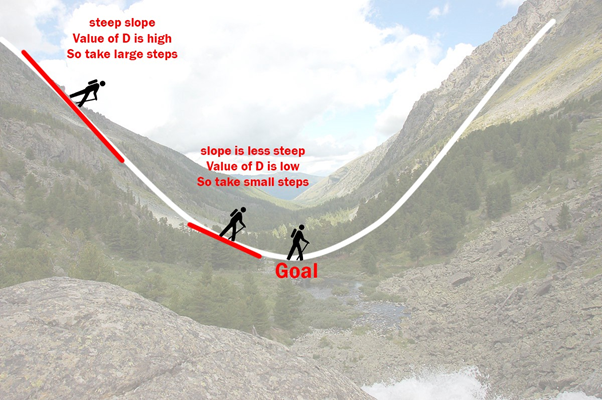
Example of gradient descent. Courtesy of towardsdatascience.com
In this example we saw why it is important for our objective function to be differentiable.
Now, let’s imagine we had a regularization parameter to our linear regression. We can use the Ridge Regression, and Ŷi = ax1i + bx2i + c + (a + b)². We want to choose the best , through hyper parameter optimization. For simplicity we will try =1, 2, 3 :
- fix = 1
- repeat the above process to determine a, b, c (with the objective function)
- evaluate metric(Y, Ŷ, =1), with the metric we want. It can be anything
We do the same thing with ⁼ 2 and 3 and choose the one which gives the best result, from metric perspective.
Why do we need metrics?
As we saw above, different models can be evaluated thanks to metrics. Metrics are more flexible than objective functions and must be business oriented. The advantage is that you will be able to communicate with less sophisticated audiences. Never forget that the end-user of your model is generally not you, and must be able to understand why your model performs well. Once your models have been trained, you can use different metrics to present it. For example, for a classification problem, you could show the true positive rate, false positive rate etc. If you’re building an algorithm to determine if one has COVID, true positive and false negative rate can be very important…
Metrics can also be used to calculate expected gain or ROI. If you can evaluate the gain / loss attached to the outcomes of your model, it can help you to show the monetary value of your work, as you can see here with a cost matrix alongside a confusion matrix:
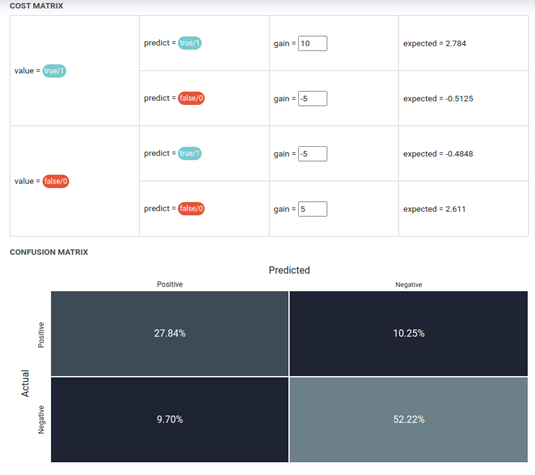
cost and confusion matrix
How to choose a good metric ?
The first question you have to ask yourself is “why am I building this machine learning model?” And, in which context will it be used? Algorithms that we build are usually used in a very well defined work environment. Let’s take a (very basic) example.
You work in a telecommunication firm. The Marketing team wants to tackle the issue of churn in your company. They noticed that customers seem to leave the company and want to prevent it. One idea is to begin a customized email campaign with some special offer for each and every customer.. If we had an unlimited budget, we could send a personal email to every customer in our database, and it would be just great, wouldn’t it? Well, we don’t have unlimited funds and resources, so we want to target customers which have the highest probability to churn. This is when you get to show your magic. Now back to metrics. We deal with a classification problem. So you will probably use a log-loss as an objective function. But log-loss is not very business oriented and I can see the long faces from here when you will say “hey, I have a log-loss of 0.12, let’s put my model in production”.
One question you should ask to the marketing team is “is it worse to miss a churner or to consider a churner as a non-churner?” In other words, is it better to optimize recall or precision…which will lead you to choose a threshold, as we will see in another blog post on classification metrics.
This reasoning can be applied to any machine learning use case. You have to discuss with the people who will actually use your model, and ask questions in a business oriented manner.
Now that we have covered an overview of what a Machine Learning metric is and how it differentiates from an objective function, we will go deeper into typical metrics for regression, classification and multi classification use cases and see which ones are the best for you.