
In this article, we will show how you can use Provision.io to create a time series experiment and the corresponding benefits.
Introduction
Time series forecasting is a machine learning method used to make predictions based on trends observed across historical time stamped data. The strength of this approach is the data is well represented in various companies and industries.
The data
In our experiment, we analyzed a company’s sales data based on the location and product type. For this purpose we are using two dataset that you can find here :
- Sales Timeseries – Trainset will be the dataset to train our model
- Sales Timeseries – Holdout will be used to validate our model
The first step will be to upload this dataset to Provision.io (go to www.Provision.io/free-trial/ to try along) and inspect the data. To do so, click on the import dataset button, then load the previously downloaded files.. Choose the name you want to give to the dataset, specify the column and decimal separator if needed and save the dataset.
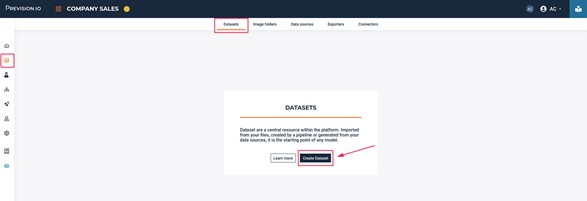
First step to import your dataset
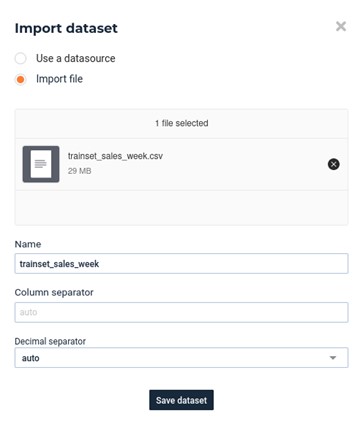
Second step to import your dataset
In order to perform your experiment, your dataset must contain:
- A temporal column
- A target column
Provision.io supports ISO 8601 format as well as as well as standard formats (e.g. DD/MM/YYYY or DD-MM-YYYY hh:mm)
Repeat the operation to import your test dataset. Once you have saved your datasets, Provision.io will automatically perform dataset statistics on your data and it will be ready to use in an experiment.
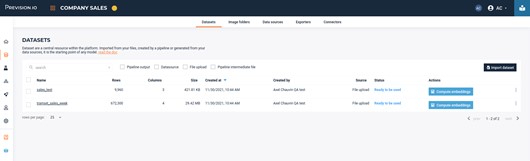
List of your datasets
Visual analytics can be found by clicking on the dataset in the list.
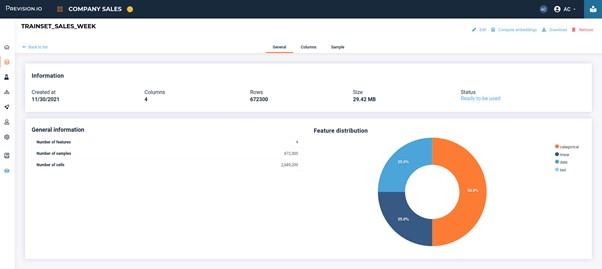
Dataset information
Train a model
Create the experiment
In order to move forward, make sure to create a new experiment >>> time series.
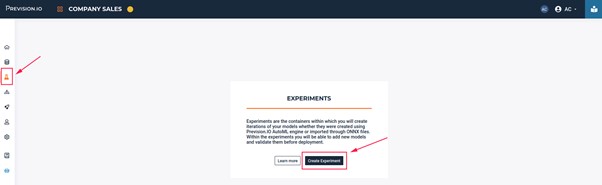
Create experiment : first step
Experiments work with versions. When you create your experiment, at first, you don’t have any version. Versioning is useful to train your experiments with different parameters (model selection, feature engineering, …).
Create your version
For our first version, we are going to use parameters to get a quick training, with basic parameters to understand if there is some signal in the training data.
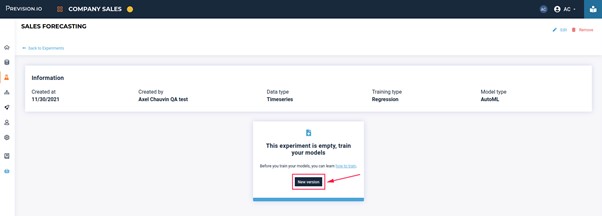
Create experiment : Step 2
You have to click on the “New version” button. Now you can start configuring your version 1 :
- Enter a description of your version
- Choose the dataset to use to train your models
- Choose the Metric
- Choose the training option performances (quick is enough for the sake of this tutorial)
- Configure the fields
- The target column
- The temporal column
- Make sure the derivation and forecast windows are correct (more details coming after)
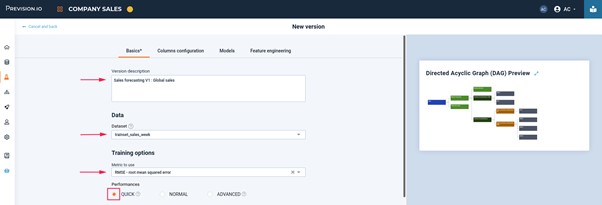
The “Field configuration” appears after completing the first fields of the form :
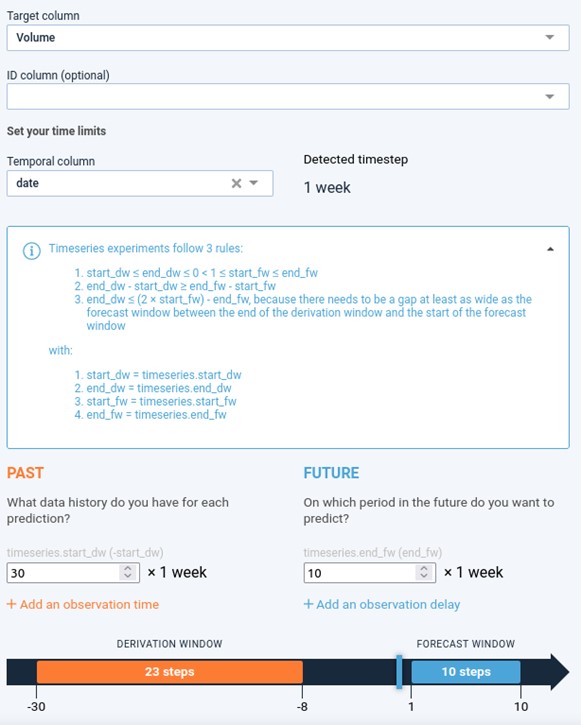
Fields configuration
Here are some important definitions related to time series experiments:
- The time step: the time difference between 2 events (within the same group), based on the temporal column
- The derivation window: the period in the past that you have available when making a prediction (the screenshot reads as follow: “I have up to 30 weeks of historical data, but not the last 8 weeks when making a prediction”)
- The forecast window: the period in the future that you want to predict (the screenshot reads as follows: “I want to predict from the next week through to the 10th week.
You can find additional information about those periods in the Provision time series configuration documentation.
Configure your columns
A priori
Sometimes, values of features may be known in the future. For instance, holidays or short term weather forecasts can be considered as “a priori” features. If this attribute is selected, Provision.io will use it as is. If not, Provision.io will consider, at best, lags of features (the exact lag will depend on the derivation window that you have defined).
Group
In case you have multiple time series in the same data set, Provision.io has you covered. To let the platform understand how to distinguish between them, you need to check some “group” features. For example, in this data set we have sales of products and for different locations at the same point in time. In order to express that to Provision.io, you need to select “product” and “location” as a group. By doing so, Provision.io will understand that there is as much underlying time series as the cardinality of product * location and will create the appropriate time derivatives features (such as lags or moving averages) based on every intersection.
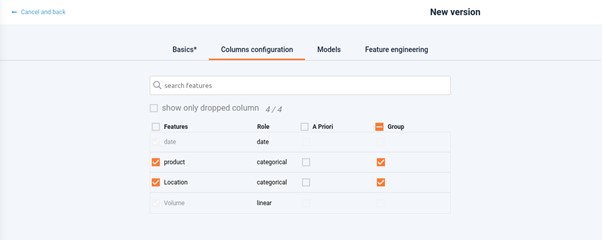
Choosing the columns configuration
Drop columns
You can also choose to unselect columns that you want to exclude from modelling. For instance, if you see on your correlation matrix that two features are perfectly correlated, you can try a version using only one of those features to compare your model’s results.
Choose your models
Select models you want to train in the models tab. Remember that the more you check, the longer it will take to generate results. Blend models combine the output from previously trained models in order to increase the predictive power. Again, this comes with a time cost.
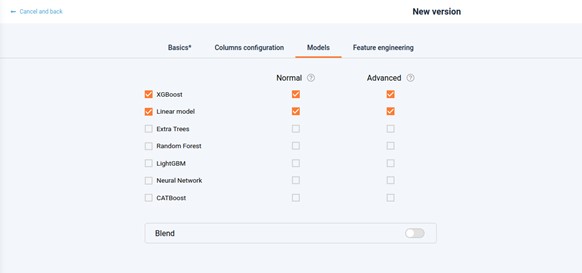
Models Experiment Settings
Feature engineering
In this section you can add or remove feature engineering. The “date” feature engineering is highly relevant in the context of time series modelling. Here, Provision.io will extract day, month, year, weekday, … information from the date. Enabling this feature engineering will improve the overall performance of your modelization at the cost of a click. You can find more information about those data processing steps in the documentation here.
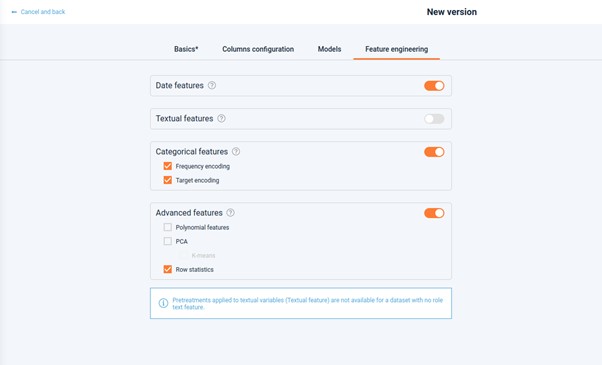
Feature engineering
Once you have completed all those steps, you can start the training by clicking on the “train” button.
During the training process, you can see the execution graph to know which tasks are done and on going. Models are added in real time along with the best score.
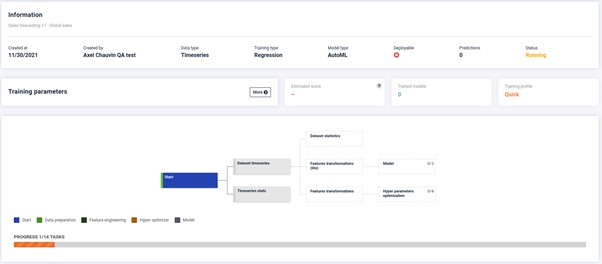
Training
In case you want to create a new version with different parameters, you just have to click on the “new version” button on the top right corner of your experiment.
New version
Results
Once your models are trained, you can compare the performances (predictive power, response time) in the general tab of your experiment.
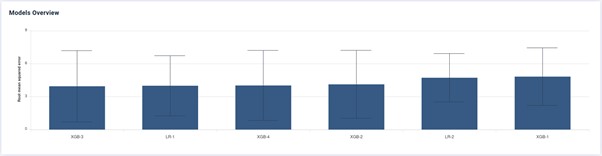
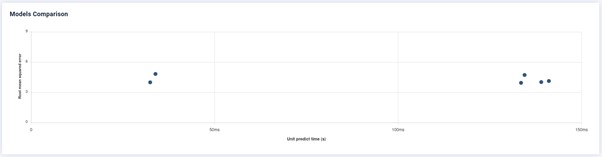
Trade-off between accuracy and unit predict time
Some plots, dedicated to time series analytics are available in the “Features” tab of your experiment. They will show you visual seasonalities present in your dataset, helping you to understand the underlying behavior of your experiment.
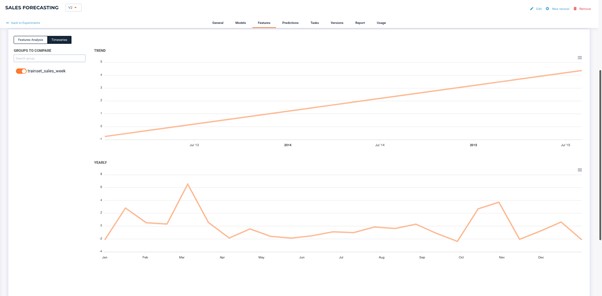
Trend of sales along the years and sales time series.
If groups are present within your experiment, you can select up to 3 time series to compare at the same time. Here I chose to compare the Basil sales in 3 different locations. We can see that the sales go down after January and go up in December.
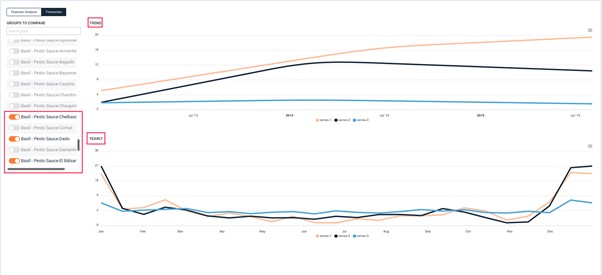
Basil sales in 3 different locations
Testing your model
In order to make predictions with a time series model, look in the “Prediction” tab of your experiment. As soon as you have set the model and the data set, Provision.io will automatically replicate the same feature engineering that has been done during the training (typically creating time based features) then making the prediction and returning the result. Please note that the file returning might have a lower number of rows. Indeed, the first rows of the test set don’t have enough historical data needed for time based feature creation.
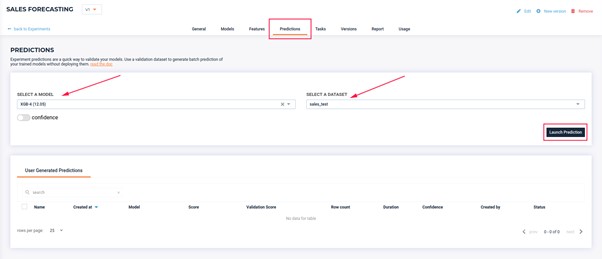
Launch predictions on a dataset with a specified model
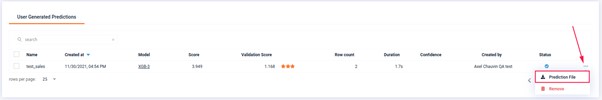
Get the prediction file
Conclusion
In this article, we went through the entire process to create your first time series experiment, from uploading your data and training your models to performing bulk predictions on your new models. You should have noticed the ease of use (even if you’re not familiar with time series), the flexibility to test multiple time series at once (groups) across with different forecast horizons, and the productivity gains by the efficiency and speed of the platform.
Try it out for yourself and let us know how you go. We are here to help!